The New York Times Employs Climate Interactive Data to Chart Out "How Trump Can Influence Climate Change"
By
Andrew P. Jones
December 8, 2016
Jasmine Lee and Adam Pearce of The New York Times created a digital story, “How Trump Can Influence Climate Change,” exploring what actions were intended to deliver upon the Paris pledge of the U.S., what actions could be lost, and where the U.S. fits globally.
We provide the following notes on the various data sources behind the graphs.
Overall Approach
The data we provided for this story pulls together several analyses from others (particularly LBNL) and some from ourselves (the C-ROADS simulation and Climate Scoreboard analysis).
This differs from other data stories we have created in the New York Times (such as this one on the Paris Pledges) and in the Washington Post (such as this one on the global implications of US leadership under a Trump administration) in that we did not create the primary emissions reduction scenarios in our C-ROADS simulator. Instead, we integrated others’ analysis except for the reference scenario and the global calculations.
The most important factors in compiling multiple analyses was ensuring that comparability was consistent across reference scenarios and that we avoided double-counting.
Historical Data and Reference Scenario
Historical net emissions data for the U.S. came from Global Carbon Budget for 2010–2015 for energy CO2. Land use, land use change, and forestry (LULUCF) emissions data for 2010–2014 comes from FAO. Data for the other greenhouse gases for 2010–2012 comes from EDGAR (4.2). F-gas data is only for 2010. We used C-ROADS to simulate the “B.A.U.” trend from the end of historical data through 2025.
Federal Government Actions to Deliver on the Pledge
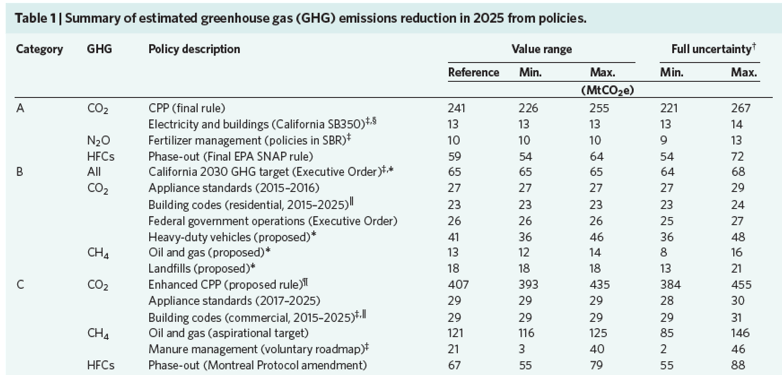
We employed analysis from “Assessment of the climate commitments and additional mitigation policies of the United States” in Nature Climate Change by Greenblatt and Wei (2016) of LBNL to calculate the impact of a wide range of federal and state actions on U.S. emissions. The paper outlines 18 different types of actions and estimated emissions reductions (see Greenblatt and Wei, Table 1) – these actions were aggregated into the two lines shown in the graphic.

Estimated Global Emissions in 2025
We used our C-ROADS simulation model to calculate 2025 emissions under two scenarios: our Reference Scenario and a future in which all countries follow 100% of their Paris pledges for 2025 or 2030 (“INDC Strict” in the table below.) The model simulates 20 regions of the world. However, we have aggregated those regions into six in the table. More information is available on our Climate Scoreboard.
Other Notes
For other information on long-term U.S. emission scenarios, particularly those that are consistent with limiting global warming below 2.0°C, or for those exploring the scenarios that support the quote by Andrew Jones in the New York Times by Coral Davenport (“Clean Energy ‘Moving Forward’ Despite Trump’s E.P.A. Pick”), please consult our analysis of mid-century strategies here.


