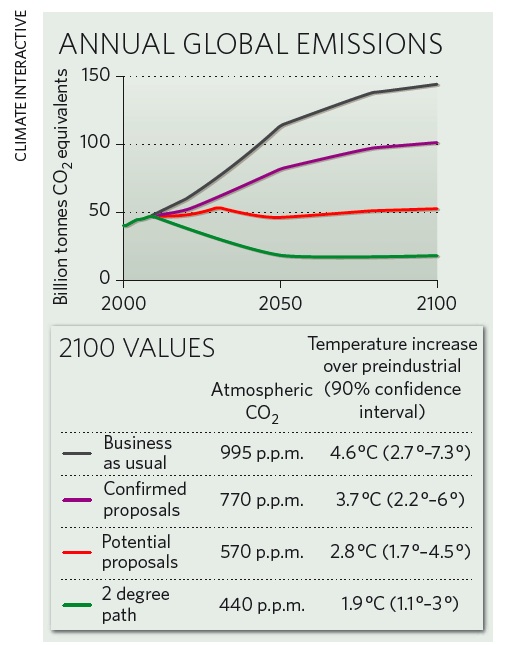
"Nature" Presents Our Climate Interactive Scoreboard Graphics
By
Andrew P. Jones
November 22, 2009
 Last week, the Journal “Nature” presented a beautiful graphic of our November “Climate Interactive Scoreboard” calculations, which shows that we have made progress in the global climate deal, but have much further to go.
Subscribers can check out the full article by Jeff Tollefson here.
The calculations behind the graphic were done in our simulation C-ROADS and are available for anyone to explore (or use to make their own graphics…) on our site here. The site has definitions of “Confirmed proposals” and “Potential proposals” as well as simulation assumptions.
Right now we are working on our December 1 update of the “Scoreboard” based on new proposals by Russia and others. Watch for it!

